Report date: August 25, 2019
Since September 4th, 2018, BCEdAccess has been collecting data on the exclusion of students with disabilities from schools in BC.
Click here to access the 2019/2020 Exclusion Tracker Form
This is our third report and a summary of the 2018/19 school year. We note that all grades, from K-12, are represented by survey respondents with the majority responding from elementary school. Here are some of the findings so far:
Districts:
Every school district had a report of exclusion.
We know that the survey’s reach is limited because of it’s digital nature however by our final report we saw at least one report of exclusion from every school district in BC. We hope to do more outreach in some of the less represented districts, but our data shows that exclusion is not an isolated issue. Although more populated districts have a larger piece of the pie chart, it’s hard to ascribe the results to any one district having more or less successful outcomes.
This summary report shows that exclusion of students with disabilities is happening everywhere in BC, in urban and rural districts. It is neither rare nor unusual. BCEdAccess has connected with organizations across Canada and around the world, and exclusion is a rising concern everywhere.
How many people?
As of June 2019 we had 492 reports with 3610 instances where students were excluded from school
What kind of schooling?
96.3% of students were from public schools and 1.8% from independent schools
For comparison, overall independent school enrollment is 12.9% of all students in BC.
Is your child designated?
5.3% of respondents said their child is waiting for assessment.
1.8% of respondents have no designation
The designations of the other 92.9% were highly varied and all categories of designation have been reported as excluded.
Category descriptions:
(A) Physically Dependent
(B) Deafblind
(C) Moderate to Profound Intellectual Disability
(D) Physical Disability or Chronic Health Impairment
(E) Visual Impairment
(F) Deaf or Hard of Hearing
(G) Autism Spectrum Disorder
(H) Intensive Behaviour Interventions or Serious Mental Illness
(P) Gifted
(Q) Learning Disabilities
(R) Students Requiring Behaviour Support or Students with Mental Illness
G (Autism Spectrum Disorder) is the designation of the students most excluded with 71.1% reported
H (Students Requiring Intensive Behaviour Intervention) is the second most excluded designation with 17% reported
How much time was missed?
This was very well covered by BCCPAC in their 2017 report. They surveyed over 800 parents and documented clearly just how much educational time has been missed by students not attending full days of school. Here is their report:
https://bccpac.bc.ca/upload/2017/11/2017-11-03-Full-Day-Summaryresults.pdf
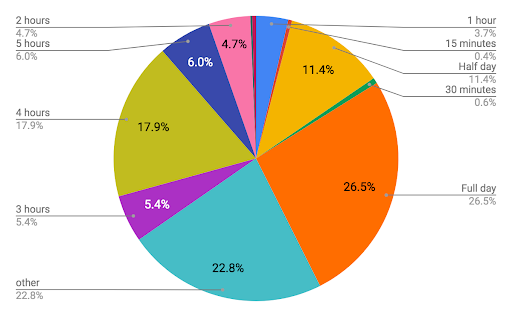
The following chart shows what exclusion looks like in according to our survey:

The largest category is full day.
The “Other’ category largely reflects the respondents from before Jan 2018 when this category represented multiple days of exclusion.
Below are more specific examples of each type of exclusion reported to us:
-Being asked not to bring their child for the first one to four weeks of school
-Is only allowed to attend 2 hours per day
-Is not allowed to attend until there is an EA in place
-Missing a half day weekly
-excluded because of bullying or other safety concerns
-If parent can attend, child can attend, but if not, child cannot attend as there are no supports
-can only attend a short part of the day; no plans to extend the time because there is no staff
-Not enough funds to support child full time
-Excluded from every field trip so far
-Excluded from all extra-curricular activities
-Excluded from course because the course materials are not adapted
-Excluded from elective high school courses
Is this still exclusion when parents “agree”?
School districts often claim that school exclusions are agreements with parents. Exclusion or “alternative schedules” may be written into the IEP. Also when asked, parents may pick their child up early from school or keep them home for the day.
What needs to be considered:
- a) Most parents don’t know it’s an option to refuse
- b) Many parents cite feeling ‘forced’ into agreeing to the exclusion
- c) Often parents are concerned about the safety of their children
- d) Only some parents are actually appealing the decision.
For the most part, families are more apt to try to work collaboratively with the school, even if it means disrupting their home and work life.
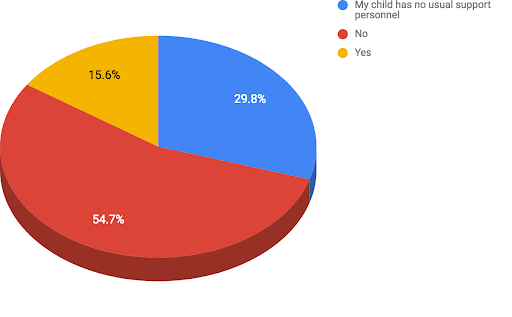
Was the child’s usual support personnel absent?

We had expected the most common answer to be “yes”.
In fact, the two biggest answers were ‘No’, and “My child has no usual support personnel’.
In trying to interpret the answer ‘no’ we infer:
- That the usual support personnel requires more support and training in how best to work with students
- That the usual support personnel do not have enough time to support the student
- That the usual support personnel has an unsustainable workload so they cannot adequately support the student.
Further investigation into this data will provide insight into the cause and provide solutions to exclusions.
It should also be noted that 29.8% percent of children being excluded have no support personnel.
Was your child physically restrained?
Inclusion BC has done 2 reports on this issue at this point – Stop Hurting Kids 1 and 2. Read them here:
http://www.inclusionbc.org/stophurtingkids
Their surveys indicate that not only does seclusion and restraint still happen in BC schools but that there has been no great change over a 5 year period. This requires urgent attention.
Our survey shows that of our respondents, 15 students were physically restrained in BC last school year (3% of respondents)
Equally concerning is that 16% of respondents communicated that they are ‘not sure’ if their child was restrained. With some children being nonverbal or having other communication deficits, parents should never be unsure if the school is providing information about the treatment of their child.
Is there anything else you would like to include?
Many respondents added more specific descriptions of the circumstances of their child’s exclusions. Some took the time to say how important the relationship with the school team was to them, and expressed fear of jeopardizing that by “complaining”. Mental health concerns feature prominently in the comments as well as the financial strain caused by unreliable schooling.

4 thoughts on “Exclusion Tracker 2018/2019 Final Report”
Comments are closed.